3.2. 存取特定時空條件的資料
![]()
Table Of Contents
本章節將以時間、空間的角度存取民生公共物聯網的資料,並以空氣品質監測作為題目進行簡易實作。
本章節會涵蓋到的技術:
- datetime, math, numpy, pandas 等函式庫應用
- json 資料格式處理
- Pandas DataFrame 資料處理
獲取特定時間序列之資料
在 pyCIOT 中在執行 get_data() 時,能夠根據時間起始及結束時間獲取資料。格式以字典 (Dict) 傳入 time_range,分別為 start, end 及 num_of_data。
start 與 end 指資料搜集的開始及結束時間,格式為 ISO8601 或 Datetime。num_of_data 則是會控制獲取資料的筆數不會超過此數字。若在範圍內的資料超過 num_of_data 則會隔一段時間搜集,使資料與資料之間的時間間隔趨於平均。
以空氣資料為例,獲取之資料最多能夠回溯一天。因此當將 end 變數設定為一天之前不會獲得任何資料,請留意。此外,因為民生物聯網中各個感測器的更新頻率不同,所以不同感測器每「天」的資料筆數會有不同,詳可參閱:https://ci.taiwan.gov.tw/dsp/dataset_air.aspx
# 從 datetime 模組中引入 datetime 和 timedelta 類別
from datetime import datetime, timedelta

end_date = datetime.now() # 獲取現在時間
isodate_end = end_date.isoformat().split(".")[0]+"Z" # 將時間格式轉為 ISO8601,去除毫秒並加上"Z"
start_date = datetime.now() + timedelta(days = -1) # 獲取前一天的時間
isodate_start = start_date.isoformat().split(".")[0]+"Z" # 將時間格式轉為 ISO8601,去除毫秒並加上"Z"

# 定義時間區間及要取得的資料數量
time = {
    "start": isodate_start,
    "end": isodate_end,
    "num_of_data": 15
}

# 從「智慧城鄉空品微型感測器-11613429495」感測器獲取一天內的 15 筆資料
data = Air().get_data("OBS:EPA_IoT", stationIds=["11613429495"], time_range=time)
data
資料會以 List 的格式儲存在 data 中,並依照不同種類的數值一起存放。溫度、相對濕度、PM2.5 的資料會分別存放在對應名字下的 ‘values’ list 下,並標上每筆資料紀錄的時間,以 ISO8601 顯示。
[{'name': '智慧城鄉空品微型感測器-11613429495',
  'description': '智慧城鄉空品微型感測器-11613429495',
  'properties': {'city': '新竹市',
   'areaType': '一般社區',
   'isMobile': 'false',
   'township': '香山區',
   'authority': '行政院環境保護署',
   'isDisplay': 'true',
   'isOutdoor': 'true',
   'stationID': '11613429495',
   'locationId': 'HC0154',
   'Description': 'AQ1001',
   'areaDescription': '新竹市香山區'},
  'data': [{'name': 'Temperature',
    'description': '溫度',
    'values': [{'timestamp': '2022-08-27T12:53:10.000Z', 'value': 30.6},
     {'timestamp': '2022-08-27T12:52:09.000Z', 'value': 30.6},
     {'timestamp': '2022-08-27T12:51:09.000Z', 'value': 30.6},
     {'timestamp': '2022-08-27T12:50:09.000Z', 'value': 30.6},
     {'timestamp': '2022-08-27T12:49:09.000Z', 'value': 30.7},
     {'timestamp': '2022-08-27T12:48:10.000Z', 'value': 30.7},
     {'timestamp': '2022-08-27T12:47:10.000Z', 'value': 30.7},
     {'timestamp': '2022-08-27T12:46:10.000Z', 'value': 30.7},
     {'timestamp': '2022-08-27T12:45:10.000Z', 'value': 30.7},
     {'timestamp': '2022-08-27T12:44:10.000Z', 'value': 30.7},
     {'timestamp': '2022-08-27T12:43:09.000Z', 'value': 30.7},
     {'timestamp': '2022-08-27T12:42:10.000Z', 'value': 30.7},
     {'timestamp': '2022-08-27T12:41:09.000Z', 'value': 30.7},
     {'timestamp': '2022-08-27T12:40:10.000Z', 'value': 30.7},
     {'timestamp': '2022-08-27T12:39:10.000Z', 'value': 30.7}]},
   {'name': 'Relative humidity',
    'description': '相對溼度',
    'values': [{'timestamp': '2022-08-27T12:54:10.000Z', 'value': 100},
     {'timestamp': '2022-08-27T12:53:10.000Z', 'value': 100},
     {'timestamp': '2022-08-27T12:52:09.000Z', 'value': 100},
     {'timestamp': '2022-08-27T12:51:09.000Z', 'value': 100},
     {'timestamp': '2022-08-27T12:50:09.000Z', 'value': 100},
     {'timestamp': '2022-08-27T12:49:09.000Z', 'value': 100},
     {'timestamp': '2022-08-27T12:48:10.000Z', 'value': 100},
     {'timestamp': '2022-08-27T12:47:10.000Z', 'value': 100},
     {'timestamp': '2022-08-27T12:46:10.000Z', 'value': 100},
     {'timestamp': '2022-08-27T12:45:10.000Z', 'value': 100},
     {'timestamp': '2022-08-27T12:44:10.000Z', 'value': 100},
     {'timestamp': '2022-08-27T12:43:09.000Z', 'value': 100},
     {'timestamp': '2022-08-27T12:42:10.000Z', 'value': 100},
     {'timestamp': '2022-08-27T12:41:09.000Z', 'value': 100},
     {'timestamp': '2022-08-27T12:40:10.000Z', 'value': 100}]},
   {'name': 'PM2.5',
    'description': '細懸浮微粒 PM2.5',
    'values': [{'timestamp': '2022-08-27T12:53:10.000Z', 'value': 11.9},
     {'timestamp': '2022-08-27T12:52:09.000Z', 'value': 12.15},
     {'timestamp': '2022-08-27T12:51:09.000Z', 'value': 12.2},
     {'timestamp': '2022-08-27T12:50:09.000Z', 'value': 12.22},
     {'timestamp': '2022-08-27T12:49:09.000Z', 'value': 12.54},
     {'timestamp': '2022-08-27T12:48:10.000Z', 'value': 12.54},
     {'timestamp': '2022-08-27T12:47:10.000Z', 'value': 12.31},
     {'timestamp': '2022-08-27T12:46:10.000Z', 'value': 12.19},
     {'timestamp': '2022-08-27T12:45:10.000Z', 'value': 12.26},
     {'timestamp': '2022-08-27T12:44:10.000Z', 'value': 12.17},
     {'timestamp': '2022-08-27T12:43:09.000Z', 'value': 12.04},
     {'timestamp': '2022-08-27T12:42:10.000Z', 'value': 11.7},
     {'timestamp': '2022-08-27T12:41:09.000Z', 'value': 11.67},
     {'timestamp': '2022-08-27T12:40:10.000Z', 'value': 11.56},
     {'timestamp': '2022-08-27T12:39:10.000Z', 'value': 11.56}]}],
  'location': {'latitude': 24.81796, 'longitude': 120.92664, 'address': None}}]
獲取特定區域之資料
在 pyCIOT 中也有根據地域獲取特定資料的方式。以特定地點的經度及緯度,以及以特定地點的經度及緯度為中心,並利用一個半徑距離構成搜尋範圍 (圓形),以獲取特定空間內的測站 ID 及感測數值。
特定區域的資料格式也是以字典 (Dict) 傳入,其中緯度、經度及半徑分別為 “latitude”、“longitude” 及 “distance”。特定區域及特定時間的篩選功能可以同時使用,搜尋特定區域時也可以將有要觀察的測站放進 “stationIds” 中,可以順便將區域外的測站去除。
# 定義一個位置資訊,包含緯度、經度和搜尋的半徑
loc = {
    "latitude": 24.990550, # 緯度
    "longitude": 121.507532, # 經度
    "distance": 3.0 # 搜尋的半徑,以公里為單位
}
# 從指定的資料來源獲取與定義位置相關的空氣資訊
c = Air().get_data(src="OBS:EPA_IoT", location = loc)
# 顯示取得搜尋結果的第一筆資料
c[0]
{
'name': '智慧城鄉空品微型感測器-10382640142',
'description': '智慧城鄉空品微型感測器-10382640142',
'properties': {
    'city': '新北市',
    'areaType': '交通',
    'isMobile': 'false',
    'township': '中和區',
    'authority': '行政院環境保護署',
    'isDisplay': 'true',
    'isOutdoor': 'true',
    'stationID': '10382640142',
    'locationId': 'TW040203A0506917',
    'Description': '廣域SAQ-210',
    'areaDescription': '中和區'},
    'data': [
        {
        'name': 'Temperature',
        'description': '溫度',
        'values': [{'timestamp': '2022-08-27T08:07:03.000Z', 'value': 35.84}]
        },{
        'name': 'Relative humidity',
        'description': '相對溼度',
        'values': [{'timestamp': '2022-08-27T08:07:03.000Z', 'value': 59.5}]
        },{
        'name': 'PM2.5',
        'description': '細懸浮微粒 PM2.5',
        'values': [{'timestamp': '2022-08-27T08:07:03.000Z', 'value': 11.09}]
        }
    ],
    'location': {
        'latitude': 24.998769,
        'longitude': 121.512717,
        'address': None
    }
}
以上為在獲取 pyCIOT 測站資料時常用的,以時間和空間為篩選標準的方法之一,適用於所有包含 location及 timestamp型態的資料。為了示範,我們舉出一些簡單的例子,並使用這些 pyCIOT 函式庫實作。
實作:所在地有比附近的空氣糟嗎?
- 匯入資料:環保署智慧城鄉空品微型感測器(OBS:EPA_IoT)
- 測試地點:中和南勢角捷運站 1 號出口:(24.990550, 121.507532)
- 比較環境:新北市中和區
獲取檢測站資料
首先,需要獲得測試地點和比較環境的所有資料。我們可以利用「獲取特定區域之資料」的方法,將經度緯度設定在南勢角捷運站一號出口,將距離設定為三公里,即可簡單的將資料利用 Air().get_data()獲取:
# 獲取檢測站的資料(溫度、濕度、 PM2.5)

# 定義一個位置資訊,包含緯度、經度和搜尋的半徑
loc = {
    "latitude": 24.990550,  # 緯度
    "longitude": 121.507532,  # 經度
    "distance": 3.0 # (km)  # 搜尋的半徑,以公里為單位
}
# 從 OBS:EPA_IoT 這個資料來源中獲取與定義位置相關的空氣資料
EPA_IoT_zhonghe_data_raw = Air().get_data(src="OBS:EPA_IoT", location = loc)
# 顯示所獲取的檢測站的總數
print("len:", len(EPA_IoT_zhonghe_data_raw))
# 顯示搜尋結果的第一筆資料
EPA_IoT_zhonghe_data_raw[0]
len: 70
{'name': '智慧城鄉空品微型感測器-10382640142',
 'description': '智慧城鄉空品微型感測器-10382640142',
 'properties': {'city': '新北市',
  'areaType': '交通',
  'isMobile': 'false',
  'township': '中和區',
  'authority': '行政院環境保護署',
  'isDisplay': 'true',
  'isOutdoor': 'true',
  'stationID': '10382640142',
  'locationId': 'TW040203A0506917',
  'Description': '廣域SAQ-210',
  'areaDescription': '中和區'},
 'data': [{'name': 'Relative humidity',
   'description': '相對溼度',
   'values': [{'timestamp': '2022-09-11T09:58:21.000Z', 'value': 94.84}]},
  {'name': 'PM2.5',
   'description': '細懸浮微粒 PM2.5',
   'values': [{'timestamp': '2022-09-11T09:58:21.000Z', 'value': 3.81}]},
  {'name': 'Temperature',
   'description': '溫度',
   'values': [{'timestamp': '2022-09-11T09:58:21.000Z', 'value': 25.72}]}],
 'location': {'latitude': 24.998769, 'longitude': 121.512717, 'address': None}}
去除無效資料
在每個範圍內的測站中,不一定每個測站都還在順利運行。為了將這些測站去除,我們觀察無效測站的資料會有什麼特徵,發現三個資料(溫度、濕度、PM2.5 濃度)都會是 0。只要挑出並刪除這些資料便能夠進行下一步驟。
# 資料清理
EPA_IoT_zhonghe_data = []
for datajson in EPA_IoT_zhonghe_data_raw:
  # 檢查是否存在 "data" 這個鍵,確認資料存在。
  if "data" not in datajson:
    continue;
  # 將原始資料格式轉換成「Temperature」、「Relative_Humidity」和「PM2_5」的格式。
  for rawdata_array in datajson['data']:
    if(rawdata_array['name'] == 'Temperature'):
      datajson['Temperature'] = rawdata_array['values'][0]['value']
    if(rawdata_array['name'] == 'Relative humidity'):
      datajson['Relative_Humidity'] = rawdata_array['values'][0]['value']
    if(rawdata_array['name'] == 'PM2.5'):
      datajson['PM2_5'] = rawdata_array['values'][0]['value']
  # 移除 'data' 這個鍵,因為我們已經取出我們需要的資訊。
  datajson.pop('data')
  # 確認資料中包含了我們所需的所有鍵,同時去除無資料(值全為 0)的檢測站
  if "Relative_Humidity" not in datajson.keys():
    continue
  if "PM2_5" not in datajson.keys():
    continue
  if "Temperature" not in datajson.keys():
    continue
  if(datajson['Relative_Humidity'] == 0 and datajson['PM2_5'] == 0 and datajson['Temperature'] == 0):
    continue
  EPA_IoT_zhonghe_data.append(datajson)

# 顯示清理後的資料筆數
print("len:", len(EPA_IoT_zhonghe_data))
# 顯示結果的第一筆資料
EPA_IoT_zhonghe_data[0]
len: 70
{'name': '智慧城鄉空品微型感測器-10382640142',
 'description': '智慧城鄉空品微型感測器-10382640142',
 'properties': {'city': '新北市',
  'areaType': '交通',
  'isMobile': 'false',
  'township': '中和區',
  'authority': '行政院環境保護署',
  'isDisplay': 'true',
  'isOutdoor': 'true',
  'stationID': '10382640142',
  'locationId': 'TW040203A0506917',
  'Description': '廣域SAQ-210',
  'areaDescription': '中和區'},
 'location': {'latitude': 24.998769, 'longitude': 121.512717, 'address': None},
 'PM2_5': 2.61,
 'Relative_Humidity': 94.27,
 'Temperature': 26.24}
計算距離
假設每個測站的資料沒有誤差,那最接近目標地點的測站資料即為要比較的資料。為了找到最接近的測站,我們要算出將每個測站和目標地點的距離。
我們可以利用點到點距離公式計算並排序找到最接近目標地點的測站,可以直接使用在 math 內的 pow() 函式,計算平方及平方根距離。但在這裡我們使用比較標準的 Haversine 公式計算地球上兩點間的球面距離,以下為在 WGS84 坐標系下的實作:
# 為資料增加一個欄位,用來表示與南勢角站的距離
import math
# 定義一個函式,計算兩點的緯度和經度之間的距離
def LLs2Dist(lat1, lon1, lat2, lon2):
    R = 6371
    dLat = (lat2 - lat1) * math.pi / 180.0
    dLon = (lon2 - lon1) * math.pi / 180.0
    a = math.sin(dLat / 2) * math.sin(dLat / 2) + math.cos(lat1 * math.pi / 180.0) * math.cos(lat2 * math.pi / 180.0) * math.sin(dLon / 2) * math.sin(dLon / 2)
    c = 2 * math.atan2(math.sqrt(a), math.sqrt(1 - a))
    dist = R * c
    return dist

# 計算每個資料點與南勢角站的距離,並將結果儲存在 'distance' 欄位中
for data in EPA_IoT_zhonghe_data:
  data['distance'] = LLs2Dist(data['location']['latitude'], data['location']['longitude'], 24.990550, 121.507532)  # (24.990550, 121.507532)
EPA_IoT_zhonghe_data[0]
{'name': '智慧城鄉空品微型感測器-10382640142',
 'description': '智慧城鄉空品微型感測器-10382640142',
 'properties': {'city': '新北市',
  'areaType': '交通',
  'isMobile': 'false',
  'township': '中和區',
  'authority': '行政院環境保護署',
  'isDisplay': 'true',
  'isOutdoor': 'true',
  'stationID': '10382640142',
  'locationId': 'TW040203A0506917',
  'Description': '廣域SAQ-210',
  'areaDescription': '中和區'},
 'location': {'latitude': 24.998769, 'longitude': 121.512717, 'address': None},
 'PM2_5': 2.61,
 'Relative_Humidity': 94.27,
 'Temperature': 26.24,
 'distance': 1.052754763080127}
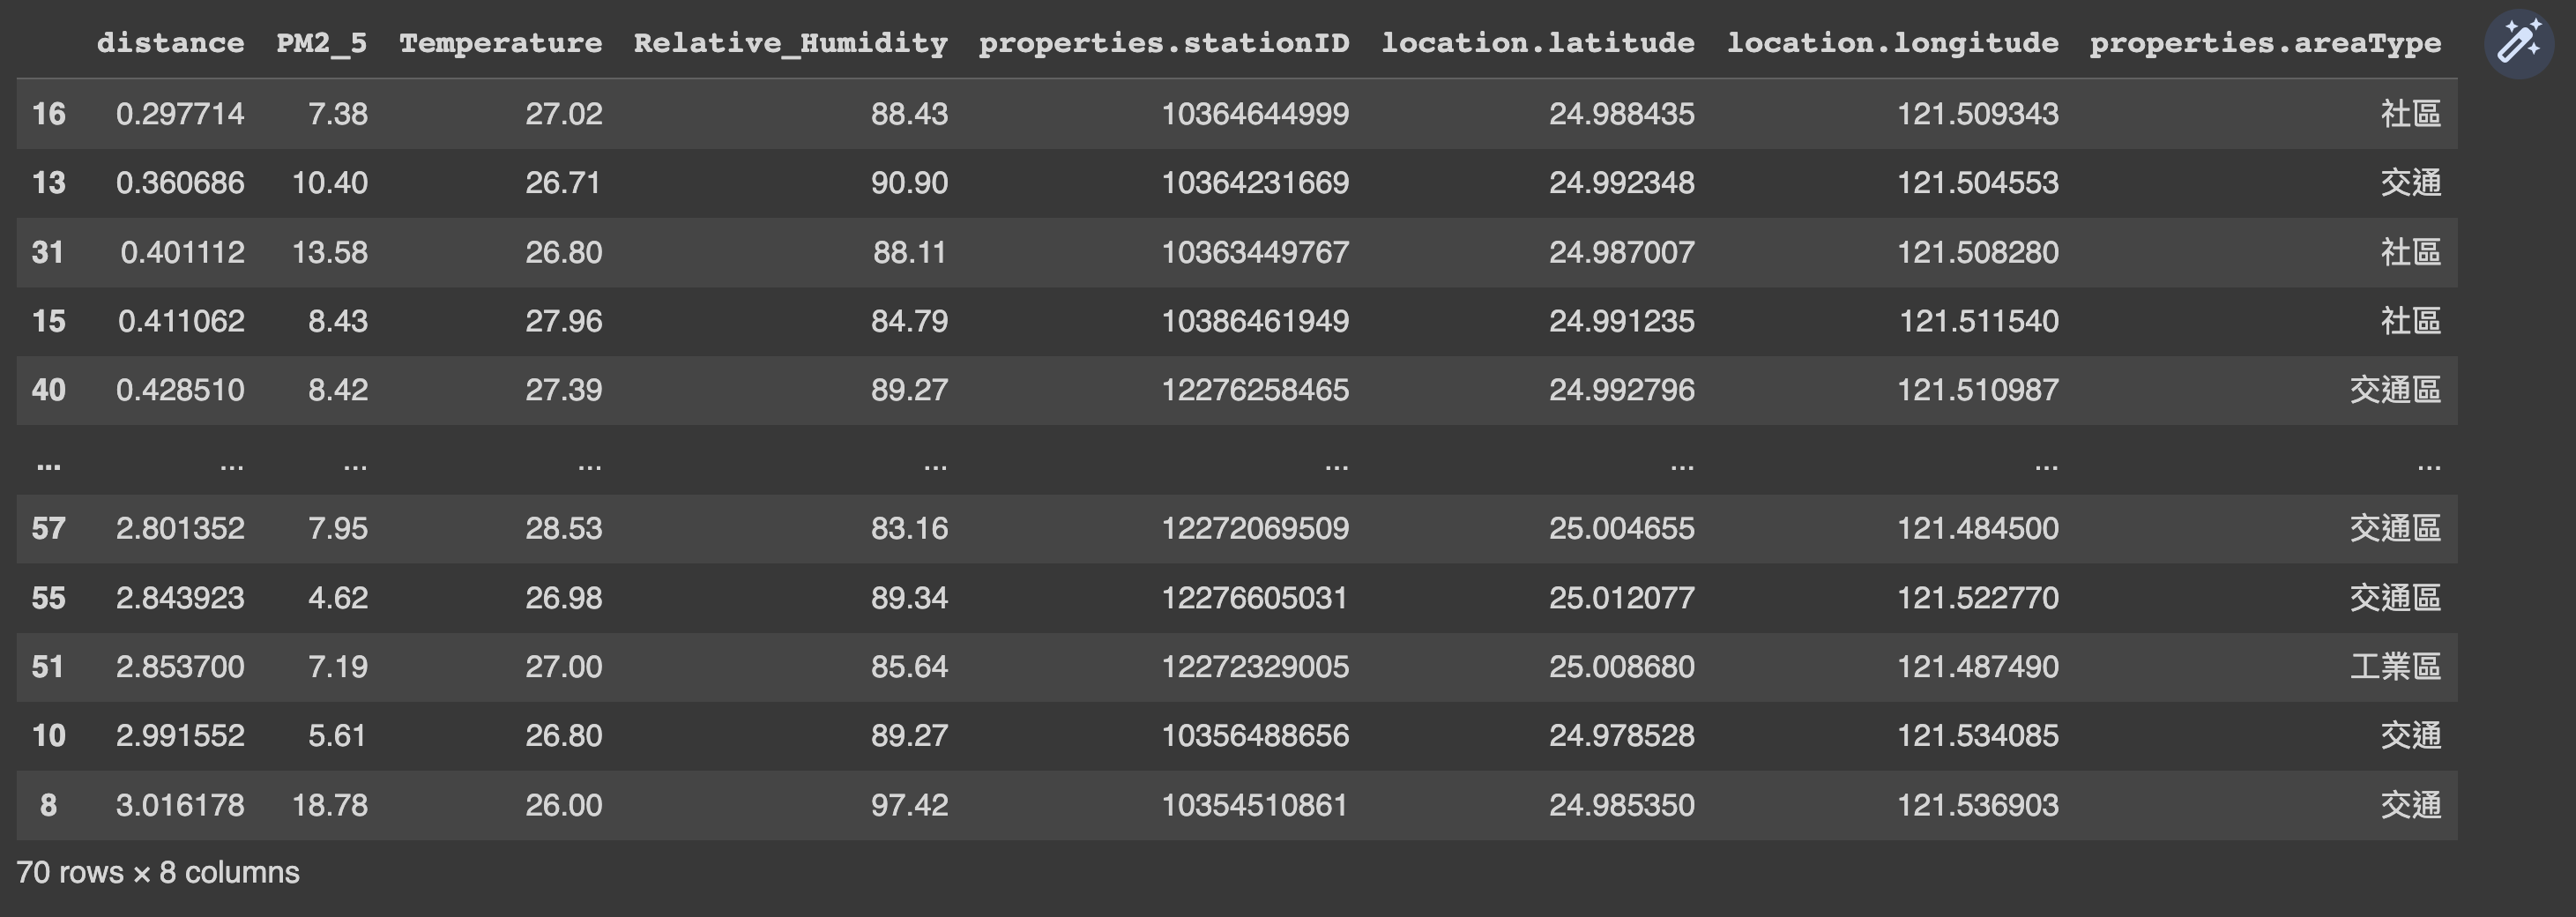
Pandas 函式庫
Pandas 是用於資料操縱和分析的函式庫,其中的 DataFrame 格式用來儲存雙維度或多欄位的資料格式,非常適合用來進行資料分析。我們將處理好的資料轉換成 DataFrame,並挑選出需要的欄位並根據先前計算的距離排序由小到大。
# 將資料轉換為 Pandas.DataFrame 格式,以便於資料分析。
import pandas as pd

# 使用 pandas 的 json_normalize 方法將 JSON 格式的資料轉換為 DataFrame。
df = pd.json_normalize(EPA_IoT_zhonghe_data)
# 顯示轉換後的完整資料。
df

# 從完整資料中選擇我們所需要的欄位。
EPA_IoT_zhonghe_data_raw = df[['distance', 'PM2_5', 'Temperature', 'Relative_Humidity', 'properties.stationID', 'location.latitude', 'location.longitude', 'properties.areaType']]
# 根據 'distance' 和 'PM2_5' 欄位排序資料。
EPA_IoT_zhonghe_data_raw = EPA_IoT_zhonghe_data_raw.sort_values(by=['distance', 'PM2_5'], ascending=True)
# 顯示處理後的資料。
EPA_IoT_zhonghe_data_raw
顯示結果
為了知道目標區域的空氣品質相較附近區域的好壞,可以大致上利用所有測站空氣品質的分佈得知。可以利用在 Python 中常利用的 numpy 資料科學處理常用函式庫等工具,或直接計算出平均及標準差,便可得到答案。
import numpy as np
# 從 EPA_IoT_zhonghe_data_raw 取得最近測站的 PM2.5 值。
# [0,1] 這裡的兩個數字是指定的行和列的索引。0 表示第一行,1 表示第二列。
zhonghe_target = EPA_IoT_zhonghe_data_raw.iloc[0,1]
# 計算 PM2.5 ([:,1]:第二列)的平均值和標準差
zhonghe_ave = np.mean(EPA_IoT_zhonghe_data_raw.iloc[:,1].values)
zhonghe_std = np.std(EPA_IoT_zhonghe_data_raw.iloc[:,1].values)
# 計算目標 PM2.5 值與平均值之間的差異,並以標準差為單位表示
result = (zhonghe_target-zhonghe_ave)/zhonghe_std

# 顯示計算的結果
print('mean:', zhonghe_ave, 'std:', zhonghe_std)
print('最近測站 PM2.5 濃度:', zhonghe_target)
print('目標離平均', result, '個標準差\n')

# 根據計算結果顯示出空氣品質的評估
if(result>0):
    print('Result: 現在家裡附近的空氣比附近糟')
else:
    print('Result: 現在家裡附近的空氣比附近好')
mean: 6.71 std: 3.18
最近測站 PM2.5 濃度: 7.38
目標離平均 0.21 個標準差

Result: 現在家裡附近的空氣比附近糟
參考資料
- Python pyCIOT package (https://pypi.org/project/pyCIOT/)
- pandas - Python Data Analysis Library (https://pandas.pydata.org/)
- 10 minutes to pandas — pandas documentation (https://pandas.pydata.org/pandas-docs/stable/user_guide/10min.html)
- NumPy (https://numpy.org/)
- NumPy quickstart (https://numpy.org/doc/stable/user/quickstart.html)
- Haversine formula - Wikipedia (https://en.wikipedia.org/wiki/Haversine_formula)
